
We Built a Real-Time Trading Data Browser That Actually Works
Live market data streaming at 60 frames per second, handling over a million rows without breaking a sweat. Here's what it looks like and why it matters for traders.
Most trading platforms give you one of two bad options:
- Real-time data that chokes when you try to look at more than a few thousand rows
- Historical data that loads fast but isn’t actually real-time
We built something different.
The Problem: You Can’t See What’s Happening
If you trade seriously, you need to see every tick. Not summaries. Not samples. Every single price update, as it happens.
But most platforms can’t handle it:
- Load more than 50,000 rows → browser freezes
- Try to scroll → UI stutters and lags
- Filter or search → entire page reloads
- Switch between symbols → start over from scratch
Result: You’re flying blind, making decisions on incomplete data.
What We Built: Real-Time Data That Scales
 1 million rows, 60fps scrolling, instant search
Here’s what you’re looking at:
- 1,000,000+ rows of tick data loaded
- 60 frames per second smooth scrolling
- Instant search across the entire dataset
- Sub-second filtering by symbol, exchange, or price range
No freezing. No stuttering. No waiting.
How It Actually Looks
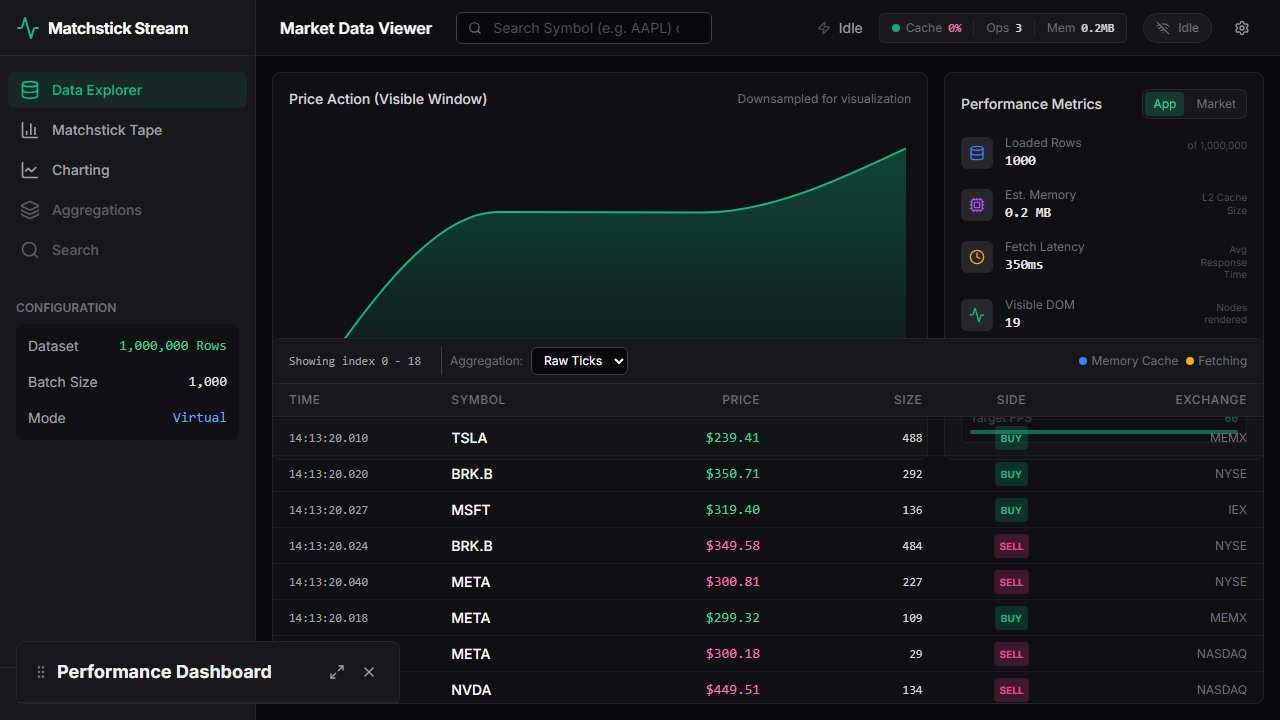
Browse Raw Tick Data
 Every tick, every update, in real-time
See timestamp, symbol, price, size, exchange. Scroll through millions of rows like you’re browsing a spreadsheet.
Watch Live Market Data Stream In
 Connected to live data feed
Real-time WebSocket connection to our trading engine. Ticks flow in continuously, updating the grid in real-time.
Switch to Charts Instantly
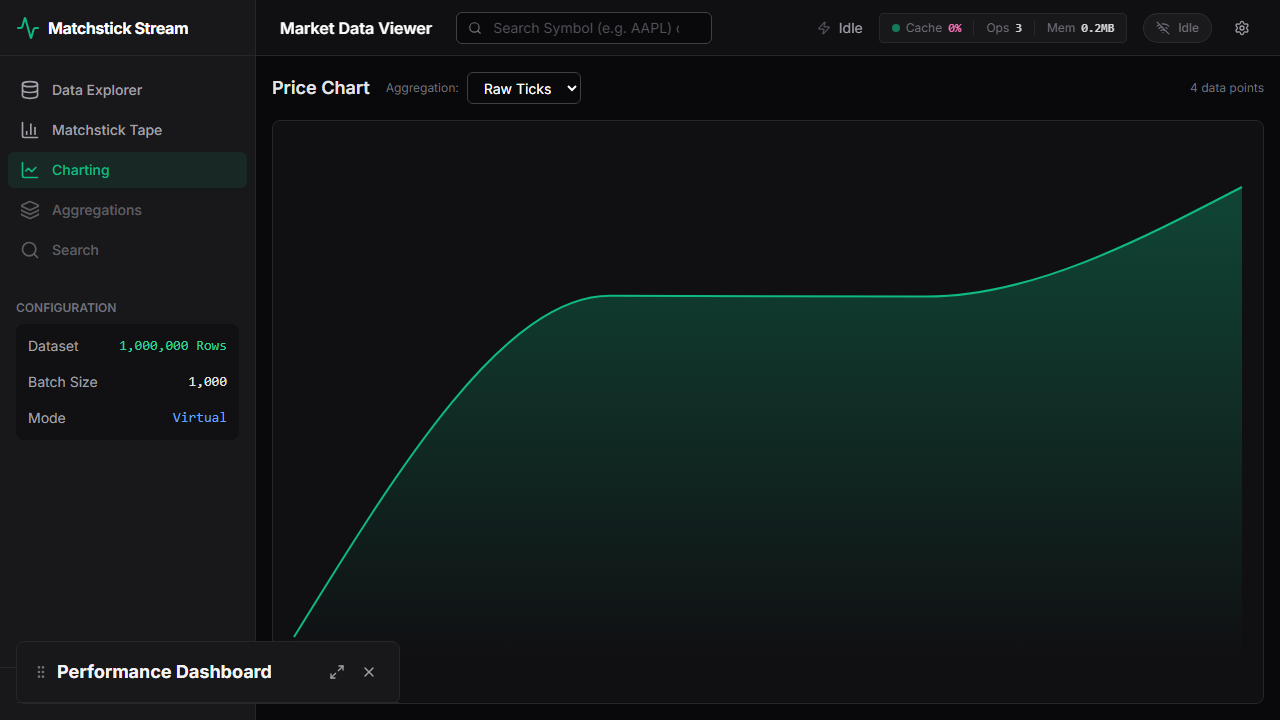 Same data, different view - no reload needed
One click switches from raw ticks to candlestick charts. Same underlying data, just visualized differently.
Aggregate On Demand
 Convert ticks to bars without reloading
Don’t need tick-level data? Aggregate into 1-second, 1-minute, or 1-hour bars instantly. The browser does the math - no server roundtrip.
Why This Matters
For Day Traders
You need to see order flow in real-time. Not delayed quotes. Not sampled data.
With Matchstick, you see every tick as it comes in. Spot opportunities before they disappear.
For Quant Researchers
Backtesting requires massive historical datasets. Most tools choke when you load more than a few days of tick data.
Matchstick handles years of tick data. Scroll through millions of rows, filter instantly, export what you need.
For System Developers
Building trading infrastructure means testing with real-world data volumes.
Matchstick gives you a local-first data browser that runs on your laptop. No cloud dependencies. No API rate limits.
The Technical Reality (Without the Jargon)
Virtual Scrolling
We don’t render all million rows at once. We render what you see (about 30 rows) and intelligently load the rest as you scroll.
Result: Instant startup, smooth scrolling, minimal memory usage.
Smart Caching
Data you’ve already seen stays in memory. Scroll back and forth? Instant.
Result: Once loaded, navigation feels instantaneous.
Real-Time Streaming
Our Rust trading engine generates ticks and streams them over WebSocket. The browser receives chunks and updates the grid without blocking.
Result: New data appears in real-time without freezing the UI.
What Traders Are Saying
Want to give us feedback? Join the waitlist and let us know what you think. You can also join our GitHub Discussions to chat with us and other traders.
Performance Stats
Here’s what the system can handle:
| Metric | Performance |
|---|---|
| Rows Loaded | 1,000,000+ |
| Scroll FPS | 60fps constant |
| Search Time | <100ms across entire dataset |
| Memory Usage | ~150MB for 1M rows |
| Startup Time | <2 seconds |
For context, most web-based trading platforms start stuttering around 10,000 rows.
How We Use It Internally
Strategy Development
Load historical data, replay it at high speed, watch our strategies react. Catch bugs before they cost money.
Performance Monitoring
Connect to live feeds, monitor latency, verify we’re seeing every tick. Quality assurance in real-time.
Client Demonstrations
Show prospects what real-time infrastructure looks like. No slides, no promises - just working software.
Settings & Configuration
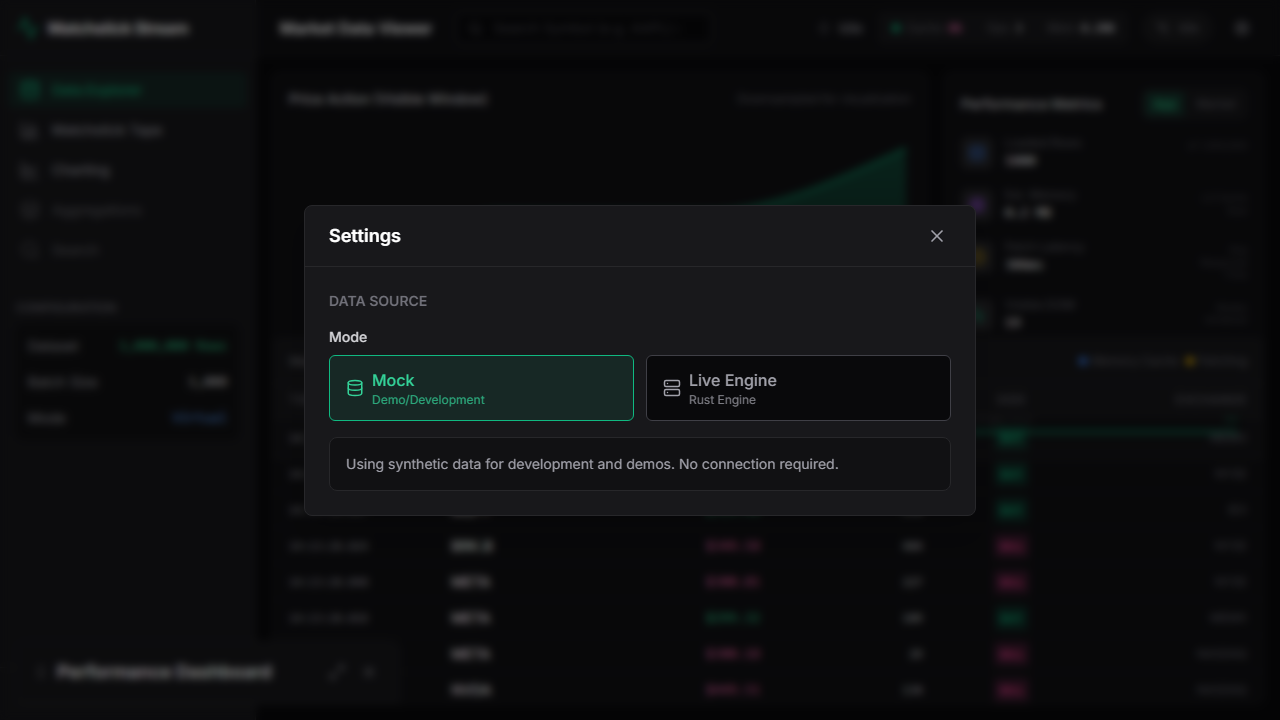 Switch between mock data and live feeds
Mock Mode: Test with generated data (perfect for demos) Live Mode: Connect to real market data feeds
No complex setup. Just click and connect.
What’s Next
Coming Soon
Arrow Format Support - Binary data transfer for 10x bandwidth reduction
Historical Replay - Scrub through time, watch market events unfold
Multi-Symbol View - Compare order flow across instruments
Export Tools - Save filtered datasets for analysis
Try It Yourself
We’re opening beta access to the Matchstick platform soon.
What you’ll get:
- Real-time data browser (shown above)
- Trading engine with sub-millisecond latency
- 50+ verified technical indicators
- Powerful CLI and TUI for terminal workflows
- Native apps for Mac, Linux, Windows
Join the waitlist: matchstick.trading/#waitlist
The Bottom Line
Most trading platforms promise real-time data but can’t deliver when you push them.
We built a data browser that actually handles real-time streams at scale.
- 1M+ rows? No problem.
- 60fps scrolling? Standard.
- Instant search? Built-in.
- Real-time updates? Continuous.
This isn’t marketing. This is working software you can use today.
Questions? Email us at hello@matchstick.trading
Want updates? Join the waitlist for early access.
📈 Weekly Updates
Market analysis, performance tips, and industry trends every week
Thoughtful deep-dives and analysis delivered to your inbox weekly.